Creating a data-oriented brand that takes users on an adventure.
DataDrive is a data analytics consultancy founded with adventure in mind, and the founder was excited to developed a brand that reflected both data and adventure. This made developing DataDrive’s brand a unique challenge, as the adventure theme had to work for highly technical and data-focused content.
-
From 2021-2022:
Traffic increased from 12,000 users to 84,000 unique users.
Blog visitors increased from 4,500 to 42,000 visitors.
LinkedIn Engagement rate from 3.6%. to 17%.
LinkedIn following increased from 322 followers to 1,188 followers.
My Contributions
Creative Director
Marketing and Content Strategist
Graphic Designer and Illustrator
Copywriter
The Starting Point
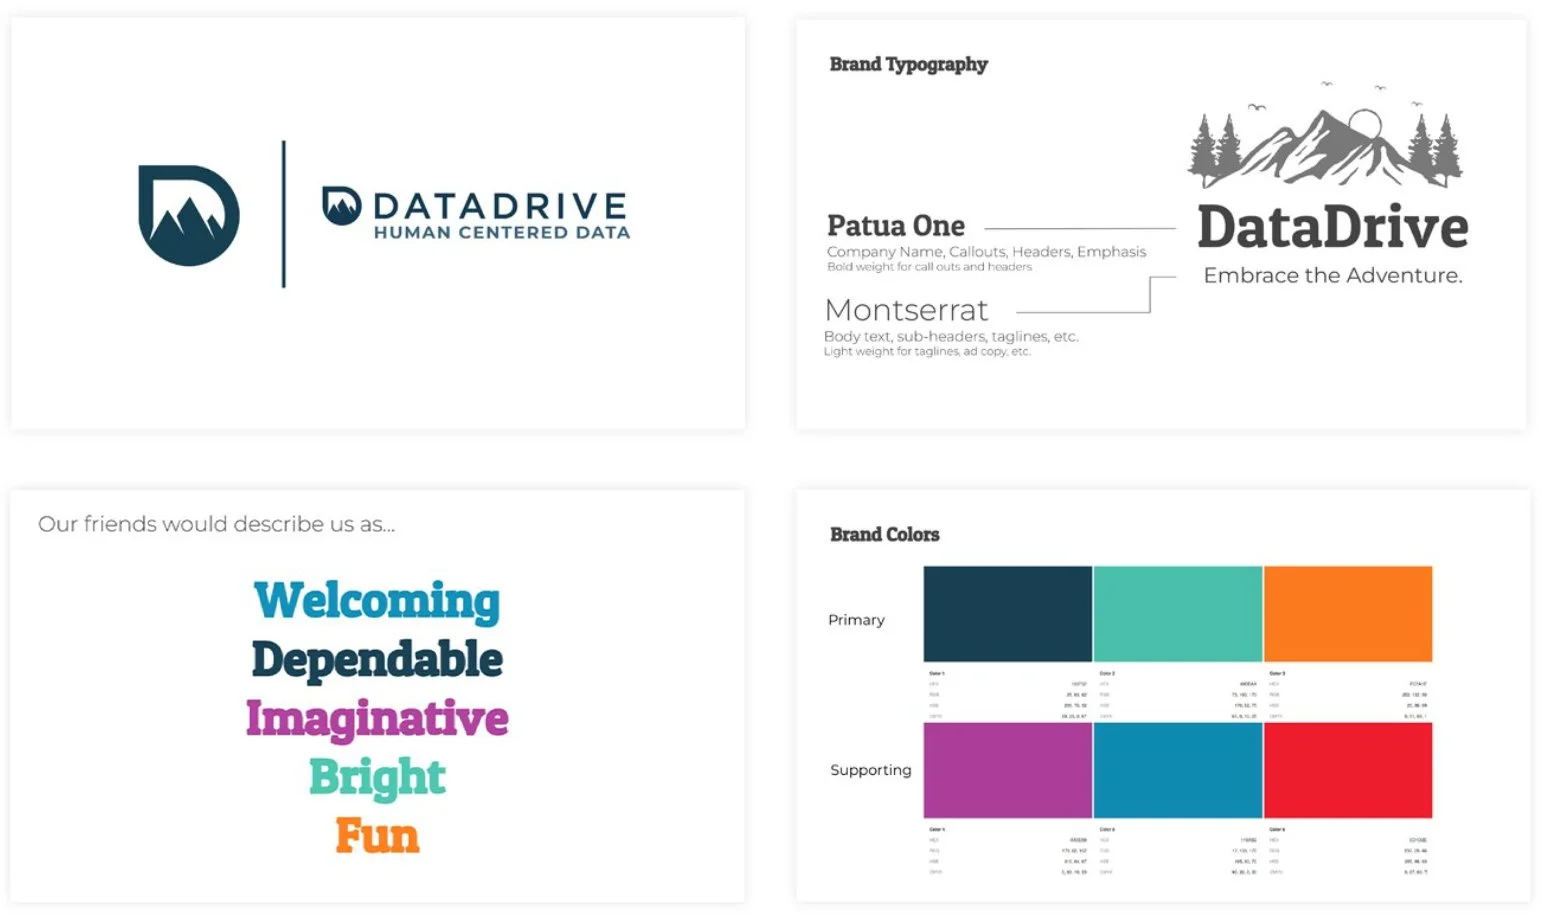
When I arrived at DataDrive, the founder and director had decided on a logo, their brand colors, and their typography. They also had a strong sense of DataDrive’s brand voice. They had started a deck, but were open to any and all new ideas. DataDrive’s brand was a rough outline with ample opportunity for creativity and fun.
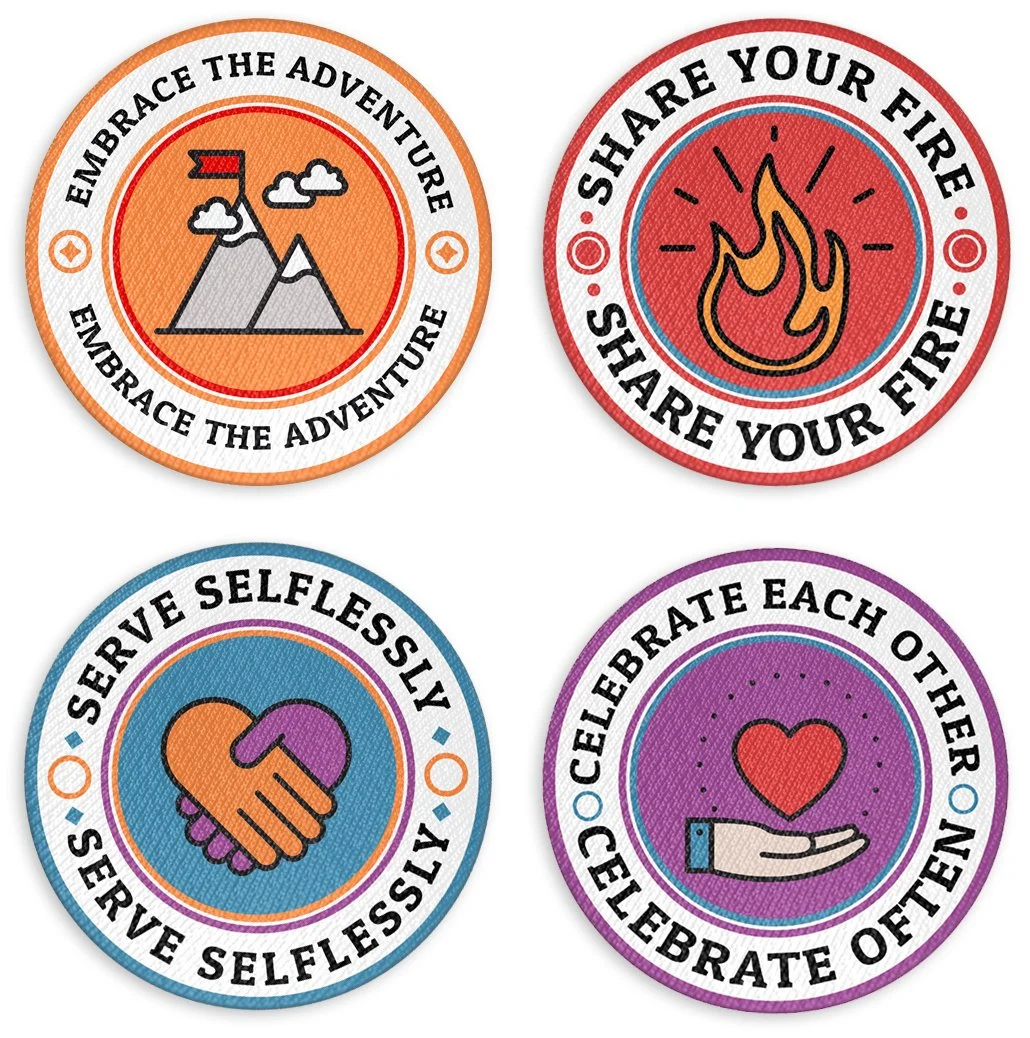
One of the first assets I created for DataDrive’s new brand were values patches, which became a core part of our brand identity. We decided early on to highlight our consultants as a key element in our brand positioning.
These patches, inspired by scouts' merit badges, symbolize values shown through team actions and initiatives. They were featured prominently on the website, in recruiting efforts, and in sales assets, embodying the essence of being a 'DataDriver'.
Bridging Business Users and Developers
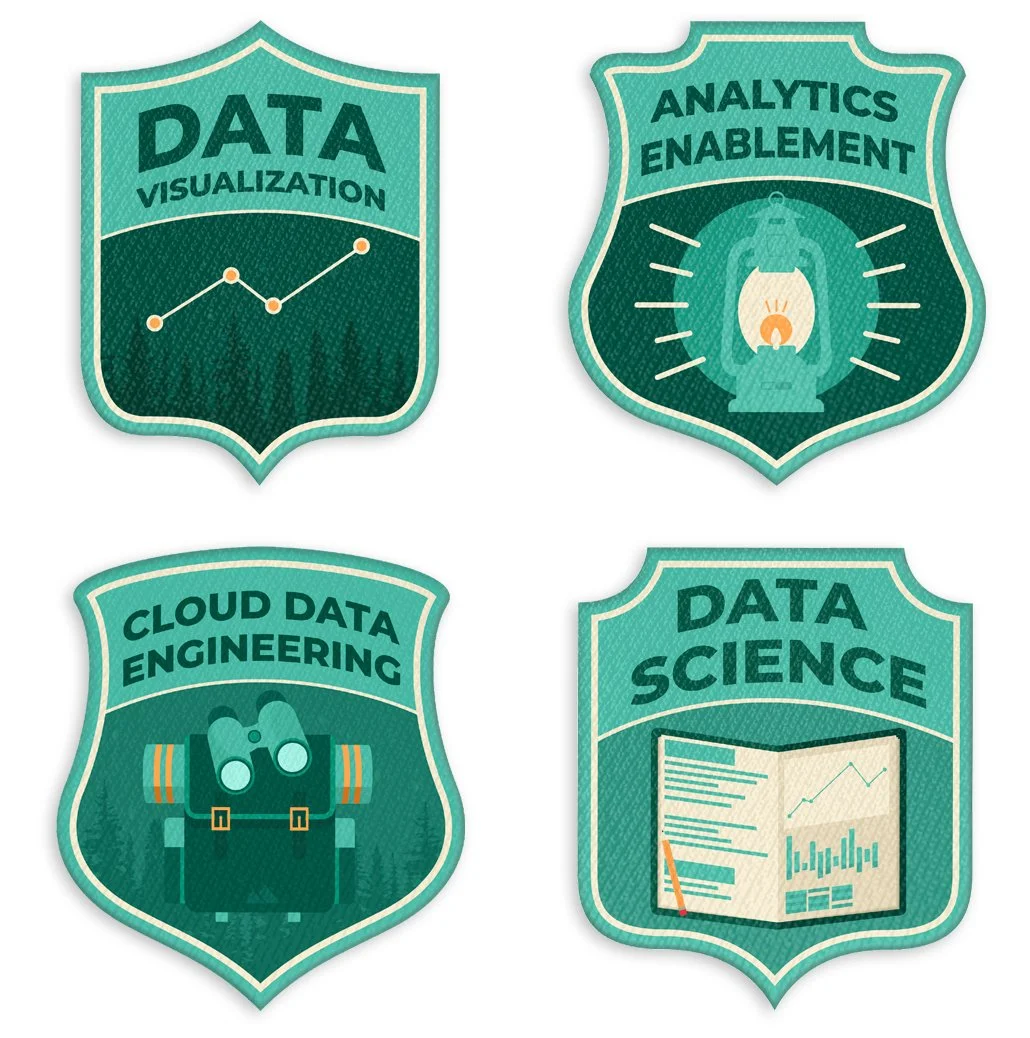
After creating the values patches, I developed our service-offering badges to represent DataDrive’s areas of expertise. Inspired by the badges worn by park rangers, they evoke a sense of expertise, ownership, and agency.
This badge and patch theme extended throughout our site. Each case study received its own plate, and we used shields for 'team' and 'values' sections, consistently reinforcing our brand identity.
Taking Users on a Journey
From the start, we knew our website would be our most active and significant brand asset and we aimed to drive as much traffic to it as possible. We wanted a site that stood out from the typical tech trend of simple, blue, modern, stock photo-filled designs.
Having chosen an adventure-themed, illustration-driven brand, we didn't stop at just using adventure-based assets. We wanted to create a true sense of adventure and take our users along for the ride.
To achieve this, I designed a homepage with a continuous background image that starts with mountain tops, reflecting DataDrive’s logo, and descends through a forest, basecamp, lake, underground cavern, and ends under the sea. Each section of the homepage corresponds to a webpage within the site, allowing users to continue exploring in the same theme as the homepage.
Visit the website case study here to see the project in its entirety!
How Did It Do?
Launching the website was how we first introduced DataDrive’s new brand, and it immediately received positive engagement. We received frequent feedback through our technology partners that our website made us stand out from other consultancies, driving clients to us. This was reflected in a huge increase in annual traffic- the site’s traffic increased from 12,000 unique users in 2021 to 84,000 users in 2022.
Creating Consistent, Killer Content
One of DataDrive’s key goals was to build a robust content marketing engine to drive leads and brand awareness through high-quality content. I led the creation and development of content, and partnered with our consultants to write DataDrive’s blog.
Developer-Focused Content:
Developers saw DataDrive as a reliable, familiar resource and we wanted to honor that sentiment as we created more content. The data analytics community is a close-knit group of developers that refer to themselves as the #datafam, and we wanted to put our developers front and center to highlight the stars of the show.
Business User-Focused Content:
Our business user-focused content content highlighted our consultants as experts and professionals and contributed to trending analytics topics.
Recruitment-Focused Content:
For our recruiting content, we chose to once again highlight our adventure-theme, as joining DataDrive was an adventure. We utilized our chosen brand illustration style for these graphics. This illustration style is used in all DataDrive blogs.
How Did It Do?
Our blog went from having 4,500 visitors in 2021 to having 42,000 visitors in 2022.
Social Media Graphics
I was in charge of DataDrive’s social media efforts. Our primary goal was to raise brand awareness and increase traffic to our content. I developed templates for our primary posts, which included welcoming new team members, recruiting consultants, sponsoring community events, and promoting webinars.
Team Member Welcome Posts
We wanted to highlight each new team member on our social media as our consultants were a main selling point for our brand. We wanted each post to feel personal. Each new team member chose their favorite values patch to display and had their areas of expertise highlighted.
Recruitment Posts
Our recruitment posts followed the same theme as our recruitment blogs. We wanted to create plenty of room to highlight DataDrive’s awards and role requirements.
Sponsored Community Events
DataDrive sponsored a variety of community events for our partners. Because these events took place outside of DataDrive, we weren’t confined to our brand when posting. We still wanted to stick to DataDrive’s personalized feel in these graphics.
Webinar Registration
Our webinars were developer-focused, and as such followed the same theme from our developer-focused blog branding. These graphics highlighted our consultants while providing the necessary webinar information to drive registrations.
How Did It Do?
Our social media strategy saw consistently high rates of engagement amongst our audience. In 2021, DataDrive’s average engagement rate was 3.6%. In 2022, our average engagement rate was 17%. Additionally, our LinkedIn following increased from 322 followers in 2021 to 1,188 followers in 2022.
We Also Made Videos!
I handled every part of the video-making process, from production to editing to animating. We wanted these videos to feel reliable, familiar, and to have a hand-made touch- we didn’t want our videos to feel templated.


